Difference between revisions of "Supporting materials for computational WeBWorK problems"
From UBCMATH WIKI
| Line 31: | Line 31: | ||
|- | |- | ||
|How to find the location of minimum slope for a given function (Google Sheets) | |How to find the location of minimum slope for a given function (Google Sheets) | ||
| − | |style="text-align:center;"|[http://www.youtube.com/watch?v= | + | |style="text-align:center;"|[http://www.youtube.com/watch?v=kRDAAjlSKc8 new video] ([http://www.youtube.com/watch?v=xtdQkTuV6IQ old video]) |
|- | |- | ||
|How to estimate slope using slope of secant line (Google Sheets) | |How to estimate slope using slope of secant line (Google Sheets) | ||
Latest revision as of 17:18, 27 September 2017
Here are some videos, interactive tools and screenshots demonstrating techniques and ideas that will be useful for doing the computational WeBWorK problems. These will continue to appear as the term progresses so keep coming back to see the newest ones.
The first three screencasts below are difficult to see on youtube due to compression. Until they are replaced with better quality versions, it is preferable to watch the full sized versions.
| Title | ||
|---|---|---|
| How to plot the graph of a function (Excel) | youtube. | mov |
| How to zoom in and out on a graph of a function (Excel) | youtube. | mov |
| How to add a second graph to a plot (Excel) | youtube. | mov |
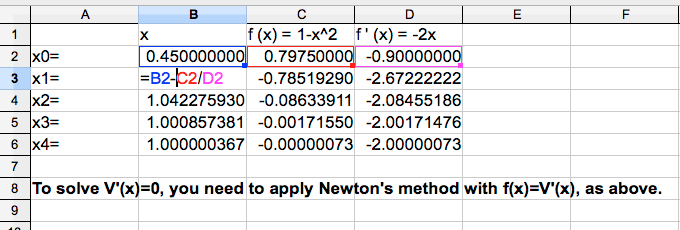
| Newton's method for solving f(x)=0 (Excel) | png | |
| An example of Newton's method using Google sheet | Google sheet | |
| How to determine when a function does or does not have inflection points (Desmos) | app | youtube |
| How to find the location of minimum slope for a given function (Google Sheets) | new video (old video) | |
| How to estimate slope using slope of secant line (Google Sheets) | youtube | |
| Fitting a line to data (part 1 - $y=ax$) | youtube. | |
| Fitting a line to data (part 2 - $y=ax+b$) | youtube. | |
| Euler's method for solving differential equations | youtube. |
Feel free to request other screencast topics either on Piazza or by emailing Prof. Eric Cytrynbaum.
Videos that explain how to use various spreadsheets for various tasks
| XY graph in Google Docs (< 2 min ) | [1] |
| ScatterPlot on iPad Numbers | [2] |
| Two plots on same axes on iPad Numbers | [3] |
| Open office scatter plot of data with trend line (<5min) | [4] |