Supporting materials for computational WeBWorK problems
From UBCMATH WIKI
Here are some screencasts demonstrating spreadsheet techniques that will be useful for doing your spreadsheet-based webwork problems. These will continue to appear as the term progresses so keep coming back to see the newest ones.
For those using Excel or similar spreadsheets
The first three screencasts below are difficult to see on youtube due to compression. Until they are replaced with better quality versions, it is preferable to watch the full sized versions. However, this might not be possible in LSK 121 until a proper viewer is installed on those machines.
| Title | Full version | Compressed youtube version |
|---|---|---|
| How to plot the graph of a function | full | youtube. |
| How to zoom in and out on a graph of a function | full | youtube. |
| How to add a second graph to a plot | full | youtube. |
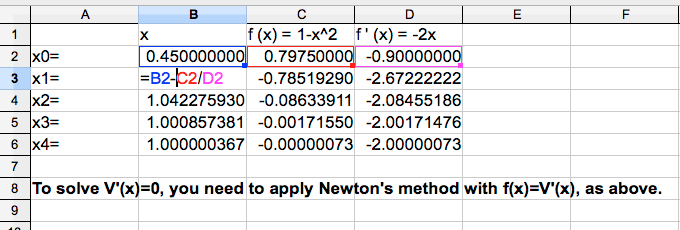
| Newton's method for solving f(x)=0 | .png | N/A. |
| Using Desmos to determine when a function does or does not have inflection points | N/A. | [1] |
Feel free to request other screencast topics either on Piazza or by emailing Prof. Eric Cytrynbaum.
| XY graph in Google Docs (< 2 min and good!) | [2] |
| ScatterPlot on iPad Numbers | [3] |
| Two plots on same axes on iPad Numbers | [4] |
| Open office scatter plot of data with trend line (<5min) | [5] |